Regionalized Cultural Access and Participation (Books And Libraries) And Science Attitudes Variables
 Regionalized Eurobarometer Survey Data
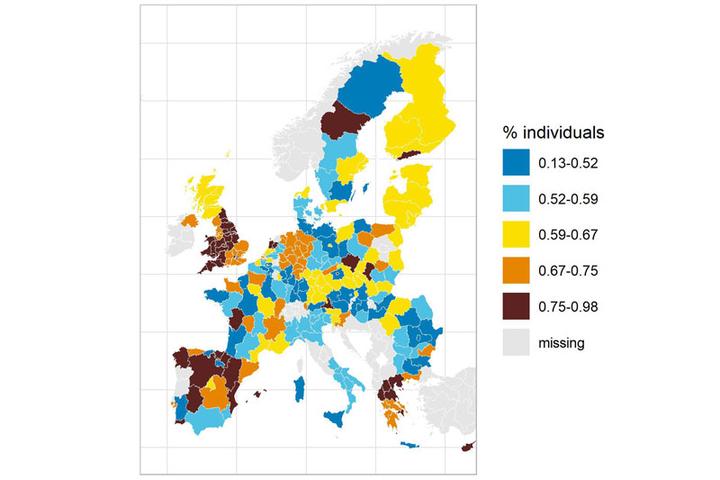
My new R package, Eurobarometer, helps the creation of data panels and regionalized statistics from the Pan-European survey’s microdata. This allows the creation of many new statistical indicators for the CEEMID Music Observatory and for many market and policy research tasks.
This example dataset (Antal 2020) was created from the microdata of the Eurobarometer 79.2 survey using the development version of the eurobarometer R package. The dataset can be downloaded from Zenodo. It will be used in a forthcoming academic publication about book piracy.
Cultural Access & Participation Variables
The read a book variable is a weighted sum of the responses that chose
from
QB1 How many times in the last twelve months have you read a book? any
answer apart from “not in the last 12 months.”

Library Access
The library access variable is a weighted sum of the responses that
chose from
QB1 How many times in the last twelve months have you visited a public libarary? any answer apart from “not in the last 12 months.”

Limited Library Access
The limited library access is a weighted sum of the responses that chose
from the question block
QB2 And for each of the following activities, please tell me why you haven’t done it or haven’t done it more often in the last 12 months? ... Visited a public library the answer option Limited or poor quality of this activity in the place where you live. In this case, the number of respondents is rather low and this is not a very reliable statistic on regional level.

Science & Technology Attitudes
The supports open access variable is a weighted sum of yes answer
options to the QD 17 Do you think that the results of publicly funded research should be made available online free of charge?
question.

Demography
The internet access question is a weighted sum of responses to the
answer option for
D46 Which of the following do you have? - An Internet connection at home.

The internet access question is a weighted sum of responses to the
answer option for D15 What is your current occupation? - student.

Data Source & Data Processing
The source of the data is the microdata file stored in GESIS for the Eurobarometer 79.2 survey.
This data file contains the microdata for the Eurobarometer 79.2 survey (TNS Opinion & Social 2013), which includes a Cultural Access and Participation Survey (see (Haan and Broek 2012; Bína, Vladimir et al. 2012)) and a Science & Technology Attitude survey.
The survey samples are designed to represent the national population, with the exceptions of Northern Ireland, the former East- and West-Germany, and the Turkish community on Cyprus. These samples are designed to be representative for these populations, too.
For weighting we used the w1 weights, which allow for post-stratification based on gender, education level and community size.
In the case of the Republic of Cyprus, Estonia, Latvia, Luxembourg and Malta regionalization is not necessary because the entire countries are equivalent to a single NUTS2 region in terms of size and homogeneity. In these countries the weighting produces representative statistics.
Unfortunately, due to a problem with the original data file, no regional information is available for the Republic of Ireland.
In the case of Germany, Great Britain and Italy, data can be summarized on the level of NUTS1 territories, and we are imputing these values into the constituent (smaller sub-)regions on NUTS2 levels. In the case of the remaining countries it can be summarized on NUTS2 levels.
Because the survey samples are designed to be nationally representative, the regional sub-samples are not necessarily representative, and often they are very small. For post stratification purposes, we created a “dirty weighting”, Using the national w1 post-stratification weights, but centered to an average value of 1 for each region.
We believe that this causes problems on more detailed answer options (on the level levels of the questionnaire’s question hierarchy.) Except for the science attitudes and the library quality questions, we used relatively simple questions that are less affected by the small, potentially biased sample size
A better option would be the creation of new, regional post-stratification weights. We believe that this would be a very interesting, but very big research task that would potentially need the cooperation of the survey’s producer, Kantar.
Citation
Daniel, Antal. 2020. “Regionalized Cultural Access and Participation (Books And Libraries) And Science Attitudes Variables 2013.” Zenodo. https://doi.org/10.5281/zenodo.3759811.
Bína, Vladimir, Chantepie, Philippe, Deboin, Valérie, Kommel, Kutt, Kotynek, Josef, and Robin, Philippe. 2012. “ESSnet-CULTURE, European Statistical System Network on Culture. Final Report.” Edited by Frank, Guy. http://ec.europa.eu/culture/our-policy-development/documents/ess-net-report-oct2012.pdf.
Haan, Jos de, and Andries van den Broek. 2012. “Nowadays Cultural Participation - an Update of What to Look for and Where to Look for It.” In ESSnet-CULTURE, European Statistical System Network on Culture. Final Report., 397–417. Luxembourg. http://ec.europa.eu/culture/our-policy-development/documents/ess-net-report-oct2012.pdf.
TNS Opinion & Social. 2013. “Cultural Access and Participation. Special Eurobarometer 399 Report.” European Commission. http://ec.europa.eu/public_opinion/archives/ebs/ebs_399_en.pdf.