I have never been a great fan of the headline figures reported by the recording industry about streaming growth. I always felt that however dynamic are those charts, artists keep complaining that they do not feel these developments. So I started to decompose those growth figures.
The Global Music Report quotes national streaming revenues on a dollar basis, which contains a lot of currency exchange noise. And behind the national total there are too many factors: subscriber base growth and repertoire growth and the subscription fee. The interplay of these forces is unpredictable. Whenever a local artist or producers sees a 10% reported national growth, they can never be sure if this will likely cause their sale to grow or shrink.
Because of the changes in the subscriber base and the available competing repertoire, it is important to see if the artist’s segment is growing, and if the competition is growing. The sales platforms will never reveal such data, and anyway, there is a competition among many sales platforms. I was looking for an analogy for a similar problem. Securities are a bit similar to songs, they will produce later cash flows, and they are competing for an always changing number of investors and with a constantly changing competition in the investible universe. Songs and their royalty flows exhibit similarities with both equity and bonds, and I believe that a good solution is the creation of song indexes, similarly to stock and bond indexes that represent the performance of various security classes. After many hours of work with the state51 data science team, and at least as much processing work for the servers, we came up with a dataset that contained data from about 700 million royalty statements. I designed a sampling method that is far from perfect, but I think it gives a first birds-eye view on the European markets.

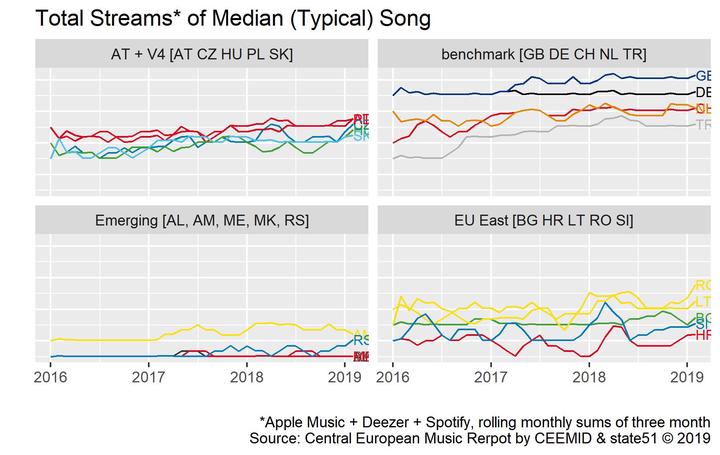
In every country and every month, we selected those exploited songs that were in the middle of the exploitation range: as many songs were less listened to as many were more listened too. For simplicity, I call those selected songs the ‘typical songs’ for each streaming platform and royalty territory. I added together the streaming quantities on the three major platforms. For every territory and month, this could have been the sales of a ‘typical’ song.
Like stock and bond indexes, we can create even more relevant indexes for certain rightsholders. In the Central European Music Industry Report, we will present for each territory a ‘domestic’ and a ‘foreign’ index, because the sales potential of a Slovak song in Slovakia or in Austria is very different from a British song in Slovakia or Austria. In Slovakia, a Slovak song is on a home territory and in Austria in a near territory, while the British song is on one of the almost 200 territories.
These findings will be open to discussion on Waves Music Showcase Festival and Conference [click for details] on 27 September 2019.